
How to configure grafana with zabbix
Grafana is an open-source web application, which can be used across a variety of platforms, provides analytics and interactive visualization. The application displays charts, graphs, and alerts for data sources connected to it. In order to make your monitoring system more efficient, Grafana offers a Grafana-Zabbix plugin that allows you to analyze Zabbix data. Also, you can use it to create awesome Grafana dashboards based on Zabbix data. The project’s main objectives are to extend Zabbix’s features related to data visualization and to provide an intuitive and powerful dashboard creation interface. Including this feature in your monitoring system will be beneficial.
Zabbix installation was already discussed previously. If you aren’t familiar with the Zabbix installation process, go through it first.
So let’s get started,
Step 1: Install Grafana on the Zabbix server
The first step is to install Grafana on the Zabbix server terminal by running the following command. You can get the latest grafana version from the official website.
# sudo apt-get install -y adduser libfontconfig1
# wget https://dl.grafana.com/enterprise/release/grafana-enterprise_8.3.4_amd64.deb

# sudo dpkg -i grafana-enterprise_8.3.4_amd64.deb
After that, you need to start Grafana. Run the command below to do so.
# sudo service grafana-server start
At this point, you can access the grafana web interface at http://{serverIP}:3000.
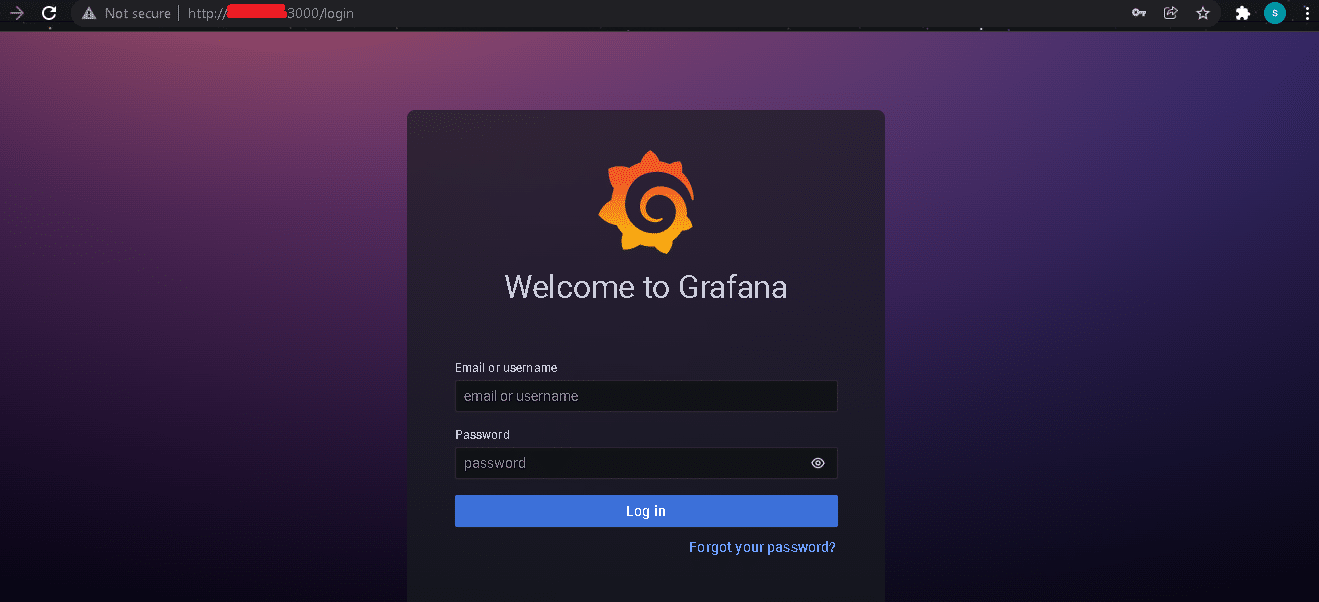
Password and username are set to admin/admin by default. Use these credentials to log in. On the following page, you will have to set a new password for your Grafana frontend. Make sure the password is strong and click on the Save button.
Step 2: Create a Database user
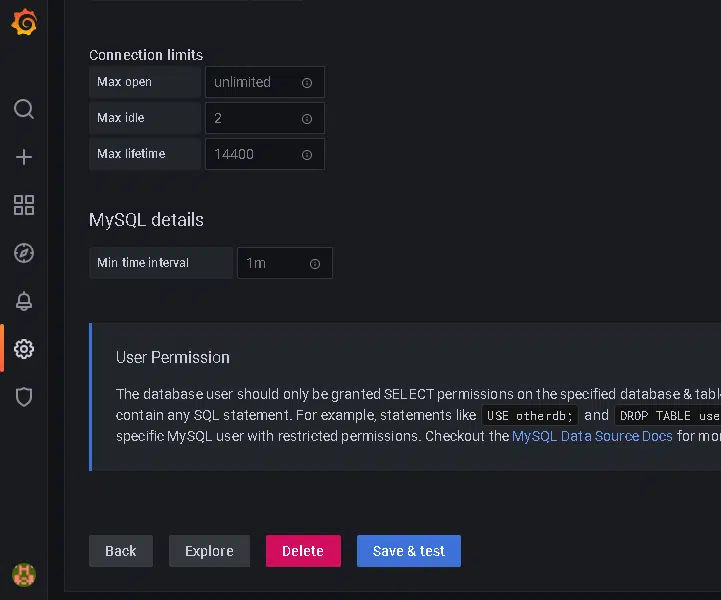
We need to create a new user called ‘grafana‘ which will only have selected permissions on the Zabbix server. Only grant SELECT permissions to the database user who will query the specified database & tables. This means that Grafana does not validate that queries are safe, so any SQL statement can be used.
Run the following command to do so,
# sudo mysql
You will be able to access MySQL after you enter your password.
In MySQL, Let’s create a user called ‘grafana‘ with password ‘Grafana123‘ by executing the following command.
# CREATE USER 'grafana'@'localhost' IDENTIFIED BY 'Grafana123';
You now need to grant the permission needed.
# GRANT SELECT ON zabbix.* TO 'grafana'@'localhost';
# FLUSH PRIVILEGES

# quit
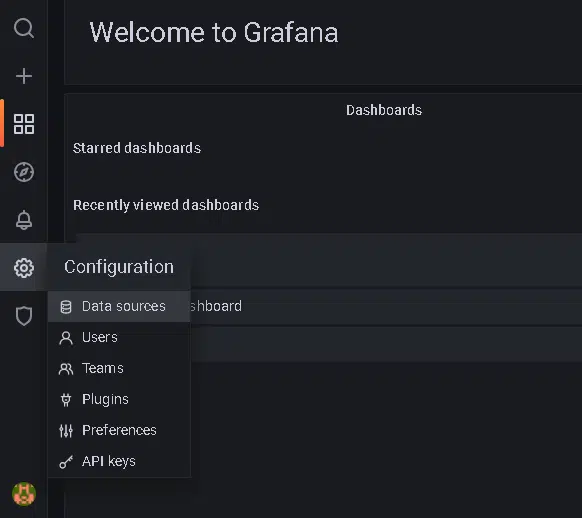
Step 3: Add the MySQL data source
We are using SQL data sources here because Zabbix allows us to retrieve data much more quickly using SQL. You can do this by selecting Data-source from the Configuration menu. After that, search for MySQL and select it.
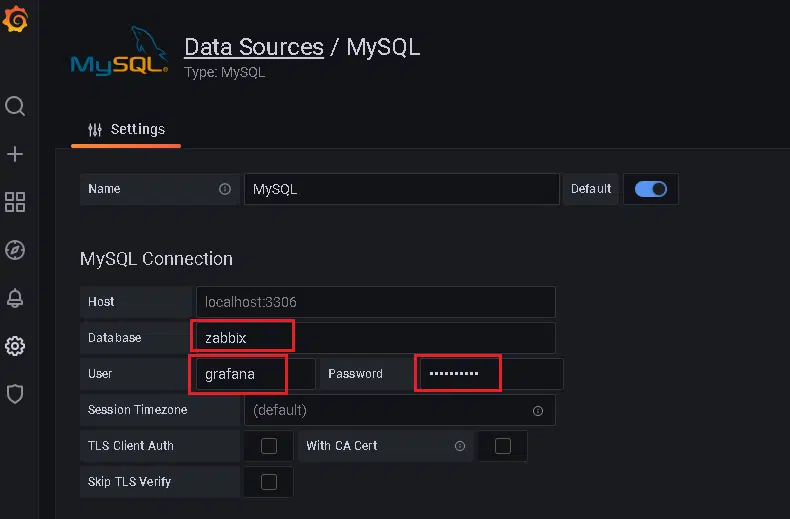
Provide the name ‘Zabbix‘ on the database. In the User/Password field, enter the same information you gave when creating the database user in step 2. Then click the ‘Save & Test‘ button.
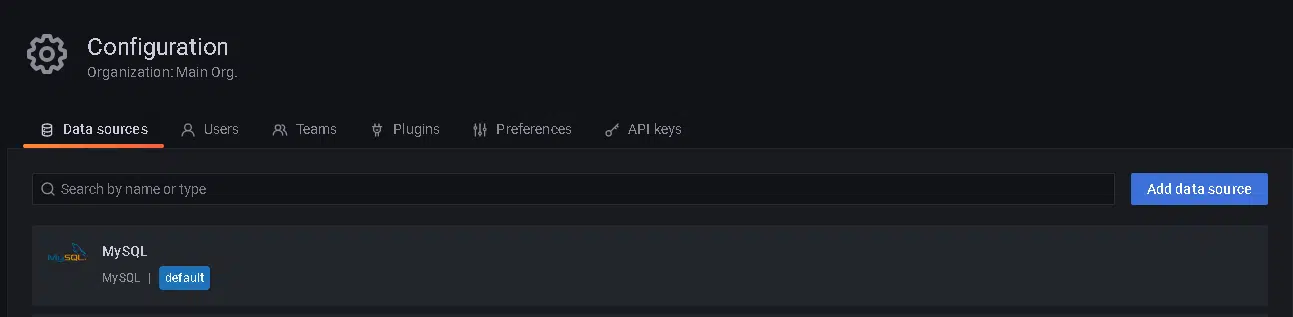
Configuration>Data sources should have MySQL listed.
Step 4: Install the Zabbix plugin
You can install the Zabbix plugin by going to Configuration > Plugins and searching for Zabbix and select the Plugin, select the plugin overview and You will find the command to install the plugin via Grafana cli on the terminal. Alternatively, you can run the command given below.
Run the following command to install:
# grafana-cli plugins install alexanderzobnin-zabbix-app
After, Restart the Grafana,
# sudo service grafana-server restart
Now, go to Data sources > Plugins and enable the Zabbix plugin by clicking on the enable button.
Step 5: Add the Zabbix data source
You can do this by selecting Data-source from the Configuration menu. After that, search for Zabbix and select it.
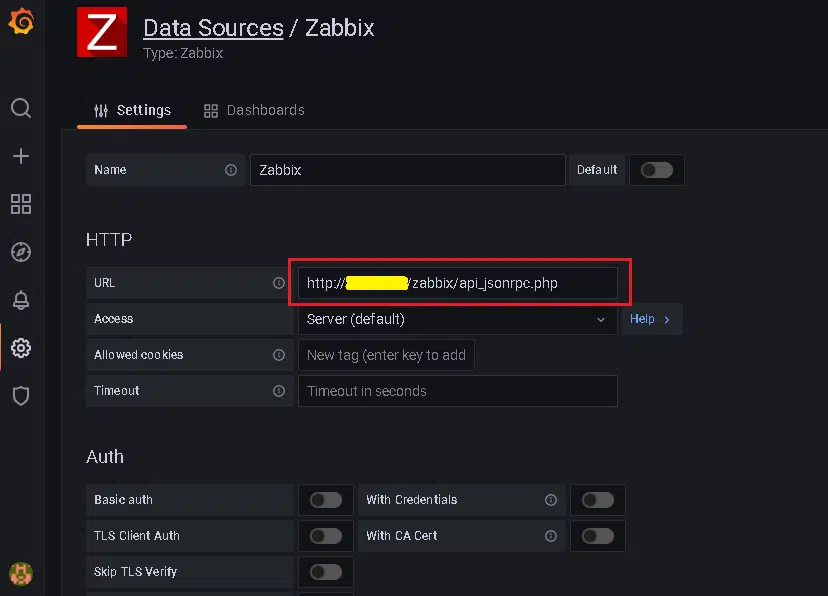
Put your zabbix server’s IP into the URL format and paste it in URL box.
http://{ServerIP}/zabbix/api_jsonrpc.php
You must enter your Zabbix user credentials for the Zabbix API details, enable the direct database connection, and select MySQL as the data source. Then click on ‘Save&test‘.
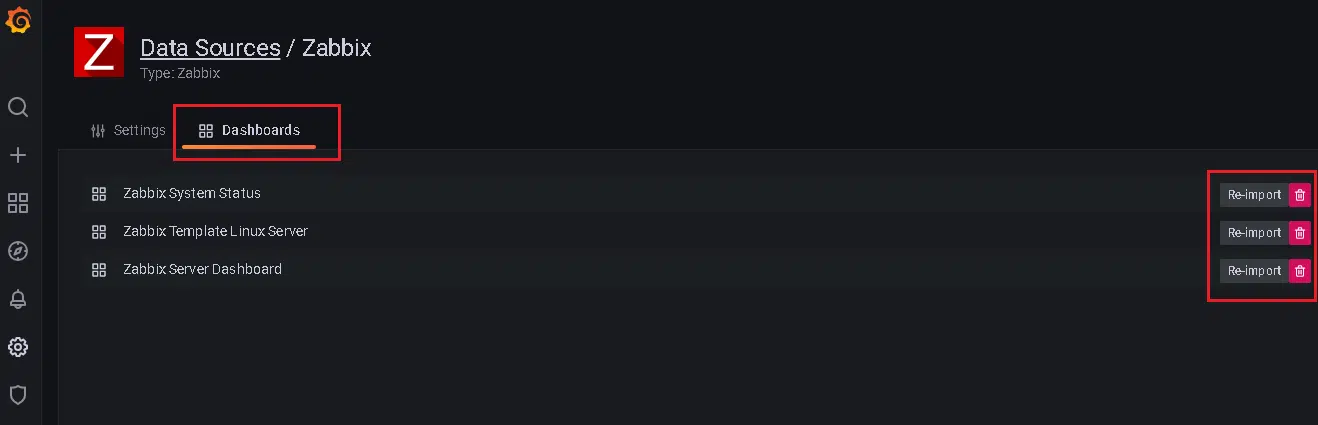
Then navigate to Data sources and select the Zabbix data source. Finally, click Dashboards and import(Here you will see re-import as I’ve already imported it) them.
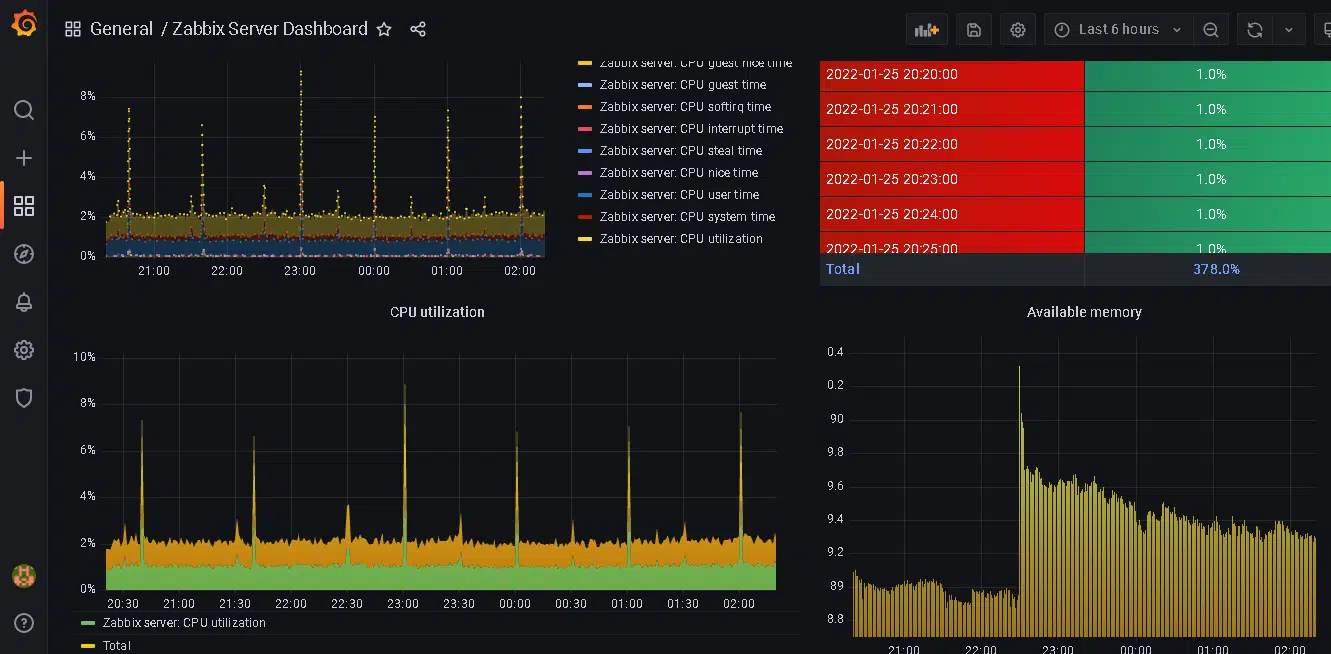
Our integration of Grafana with Zabbix server has been successful. Check out the imported dashboards by visiting the home page. With Grafana, you can add Zabbix devices for awesome monitoring. Thanks for reading! I hope it was informative for you!
FAQ
Grafana is an open-source data visualization and monitoring tool, while Zabbix is an open-source monitoring software that can monitor various network services, servers, and other IT components.
Grafana provides a user-friendly interface to visualize and monitor data, while Zabbix provides detailed data on the IT components being monitored. By configuring Grafana with Zabbix, you can get the best of 2 worlds – the ability to monitor and visualize your data in real time.
Grafana and Zabbix can be installed on various operating systems. You can download the installation files from their official websites and follow the instructions provided in the documentation.
After installing Grafana and the Zabbix data source plugin, go to Configuration -> Data Sources -> Add Data Source. Choose Zabbix as the type and provide the required information, such as Zabbix API URL, Zabbix username, and password.
A dashboard in Grafana is a collection of panels that display data in real time. You can customize the dashboard by adding panels, changing the layout, and setting alerts.
To add a panel to your dashboard, click on “New Dashboard” and then click on “Add Panel.” You can choose the data source and select the metrics you want to display in the panel.
Yes, you can customize your dashboard in Grafana by adding more panels, changing the layout, and setting alerts. Grafana provides many options to customize the dashboard according to your requirements.
To set up alerts in Grafana, go to the dashboard menu and click on “Alerts.” You can add a new alert rule and set the conditions for triggering the alert.