How to install HTOP in Linux
This interactive system monitors and process manager allows you to view and manage your processes. It is a replacement for the Unix program top. It shows information about the system’s functions, memory usage, average load, etc. Its Process Monitor is an interactive process viewer that runs across various platforms. HTOP is similar to TOP, but it is considerably improved over TOP.
In this guide, you will learn how to install HTOP on Linux. Linux distributions used here are CentOS, RHEL, Ubuntu, and Debian.
So let’s begin,
Step 1: Set up a VPSie cloud server
Start by logging into your VPSie account. Please make a new server; several Linux distributions are available on vpsie, and after creating one, use the credentials we emailed you to connect to your Cloud Server via SSH.
Install HTOP in Ubuntu / Debian
It is not necessary to install any other repositories. Htop packages are included with the default Ubuntu/Debian repository. You can install them by running this command.
# sudo apt install htop
Verify the installation,
# apt show htop
Output,
# apt show htop
Package: htop
Version: 2.2.0-2build1
Priority: optional
Section: utils
Origin: Ubuntu
Maintainer: Ubuntu Developers <[email protected]>
Original-Maintainer: Daniel Lange <[email protected]>
Bugs: https://bugs.launchpad.net/ubuntu/+filebug
Installed-Size: 225 kB
Depends: libc6 (>= 2.15), libncursesw6 (>= 6), libtinfo6 (>= 6)
Suggests: lsof, strace
Homepage: https://hisham.hm/htop/
Task: server, cloud-image, lubuntu-desktop
Download-Size: 80.5 kB
........
Install HTOP in CentOS / RHEL
CentOS / RHEL Htop packages can be found in the EPEL repositories, which must be installed on our system if it is not already. To do this, type the following command, which installs EPEL on our system.
# yum install epel-release
We can now install it with yum,
# yum install htop
Install HTOP using the source package.
First, Check the latest top repository from Github, then configure and compile a script to install the below.
Complete the following commands with your latest Htop version,
$ wget -O htop-3.1.1.tar.gz https://github.com/htop-dev/htop/archive/refs/tags/3.1.1.tar.gz

$ tar xvfvz htop-3.1.1.tar.gz

$ cd htop-3.1.1/

$ ./configure

$ make

$ sudo make install
Step 2: Using Htop
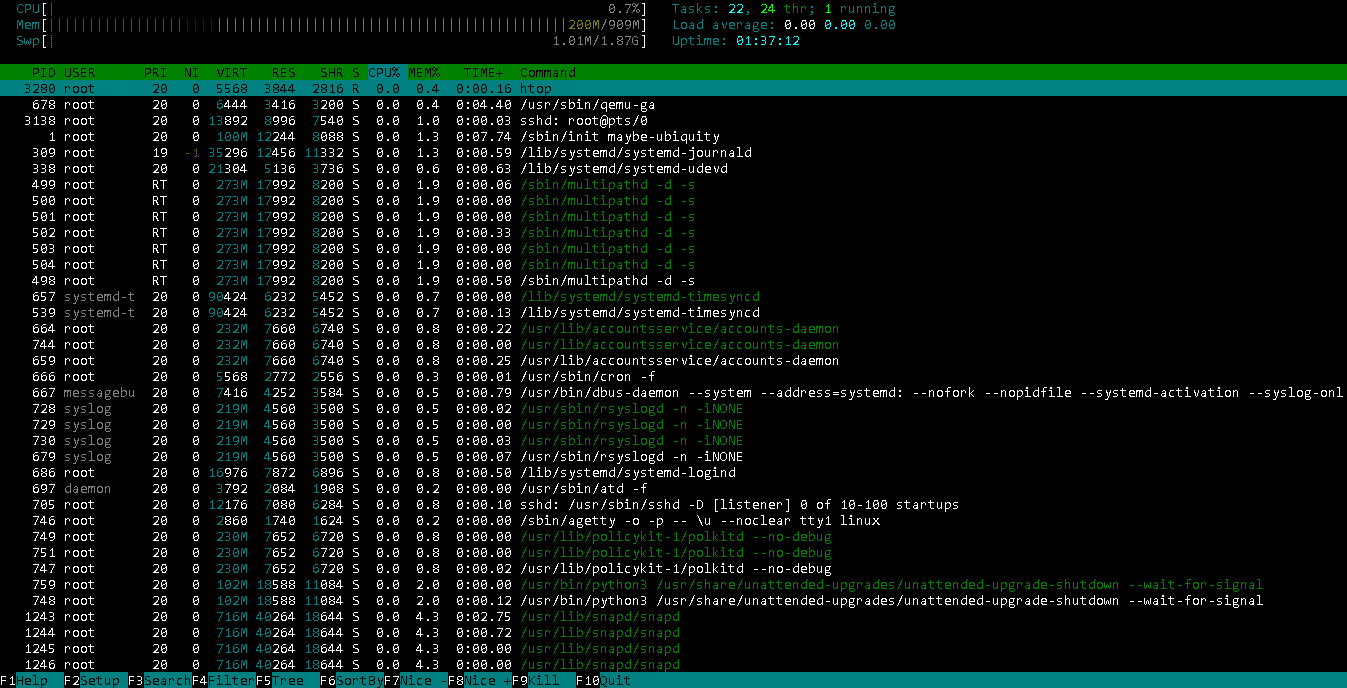
Htop has three sections mainly,
- The header shows CPU, Memory, Swap, tasks, load average, and uptime.
- List of processes sorted by CPU utilization.
- The footer includes options such as help, setup, filter tree kill, nice, quit, etc.
Let’s start using it,
You can use htop by opening a terminal and running the following command,
# htop


where-to-find-cpanel-whm-logs-for-apache-email-ftp-mysql-errors
For more information on the options available with the htop command, you can run the help command.
# htop --help
We’ve finished our tutorial on installing HTOP on Linux. Let’s hope you found the information helpful.
Where to find cPanel, WHM logs for Apache, email, FTP, MySQL errors
FAQ
htop is an interactive process viewer for Linux/Unix systems. It provides a real-time, color-coded display of system processes and resource usage, allowing you to monitor your system’s performance and identify resource bottlenecks.
You can install htop on Linux using the following steps:
- Open a terminal on your Linux system.
- Run the correct command for your Linux distribution to install htop:
- Ubuntu/Debian: sudo apt-get install htop
- CentOS/RHEL: sudo yum install htop
- Fedora: sudo dnf install htop
- Arch Linux: sudo pacman -S htop
- Wait for the installation to complete.
To run htop, open a terminal and type “htop,” followed by pressing the “Enter” key. This will launch the htop process viewer in your terminal window.
htop displays the following information:
- Process ID (PID)
- User
- Process status (e.g., running, sleeping, zombie)
- CPU usage (as a percentage)
- Memory usage (as a percentage)
- Swap usage (as a percentage)
- Virtual memory usage (as a percentage)
- Process name and command-line arguments
- Number of threads
- Priority
- Nice value
By default, htop sorts processes by CPU usage. You can sort by other columns by pressing the corresponding function key (e.g., F6 for sorting by memory usage). You can also reverse the sort order by pressing “Shift”+”F6” (or the corresponding function key).
To search for a process in htop, press the “/” key followed by the process name or keyword you want to search for. Press “Enter” to start the search and “n” to find the next occurrence.
To kill a process in htop, select the process using the arrow keys and press the “F9” key (or the corresponding function key) to bring up the “Kill” menu. Select the appropriate signal (e.g., SIGTERM) and press “Enter” to send the signal to the selected process.
htop is highly customizable. You can customize the colors, the columns displayed, and the update frequency, among other things. To customize htop, press the “F2” key (or the corresponding function key) to bring up the “Setup” menu. Using the arrow keys to navigate the menu and make changes, and press “Enter” to save your changes.