The Metrics section under each VM’s settings in the VPSie Control Panel provides a graphical representation of resource utilization over time. It allows users to monitor performance trends, detect anomalies, and make data-driven scaling decisions.
Available Metrics:
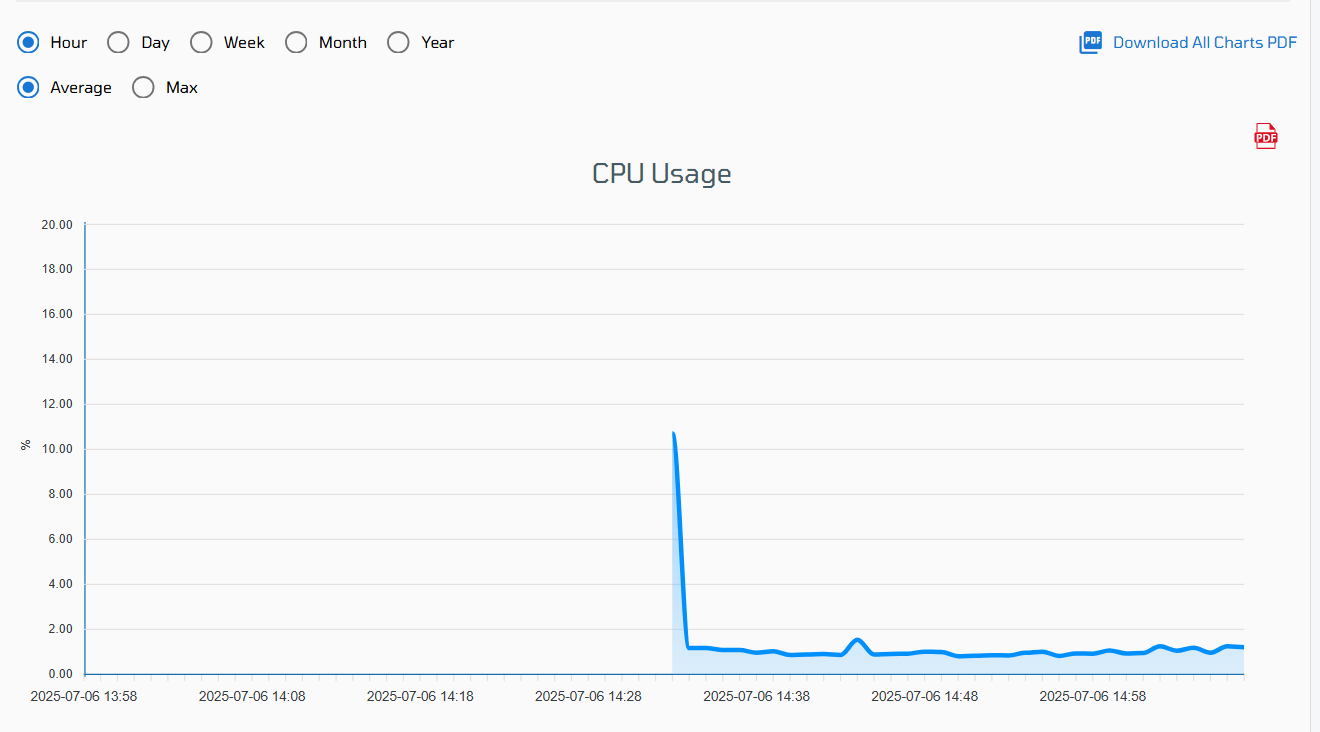
1. CPU Usage
- Displays the percentage of CPU resources consumed by your VM over time.
- Helps identify high CPU load, potential performance bottlenecks, or idle capacity.
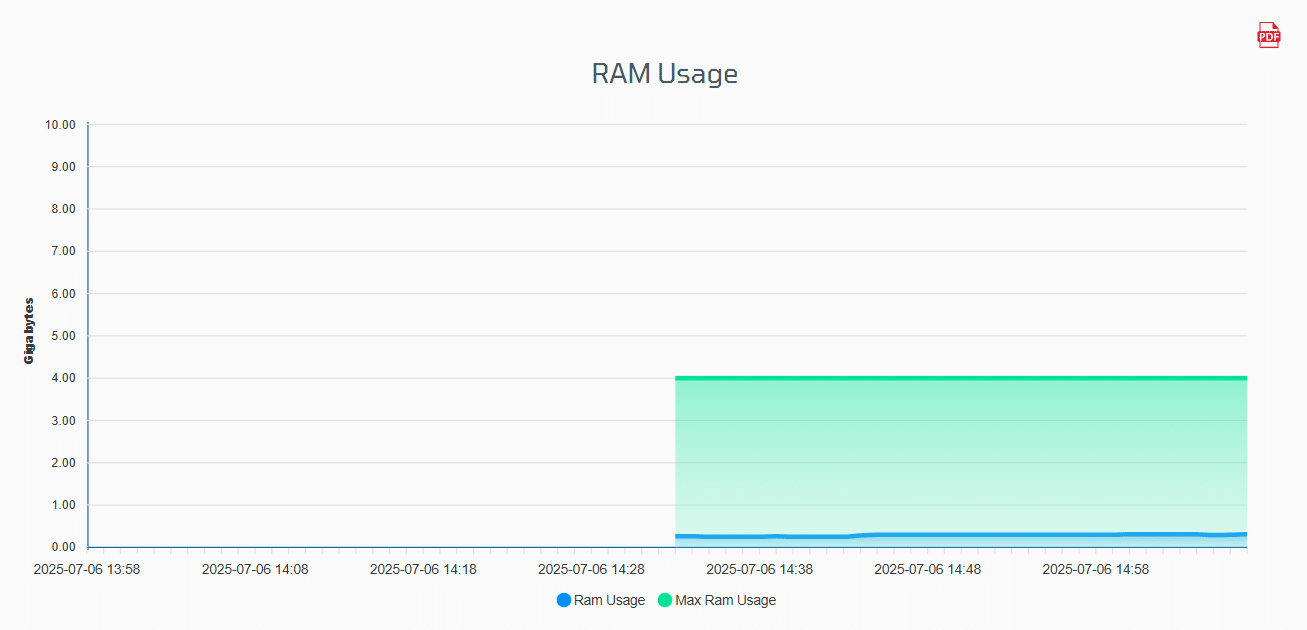
2. RAM Usage
- Shows memory utilization, including used, cached, and available memory.
- Useful for monitoring memory leaks or insufficient RAM allocation.
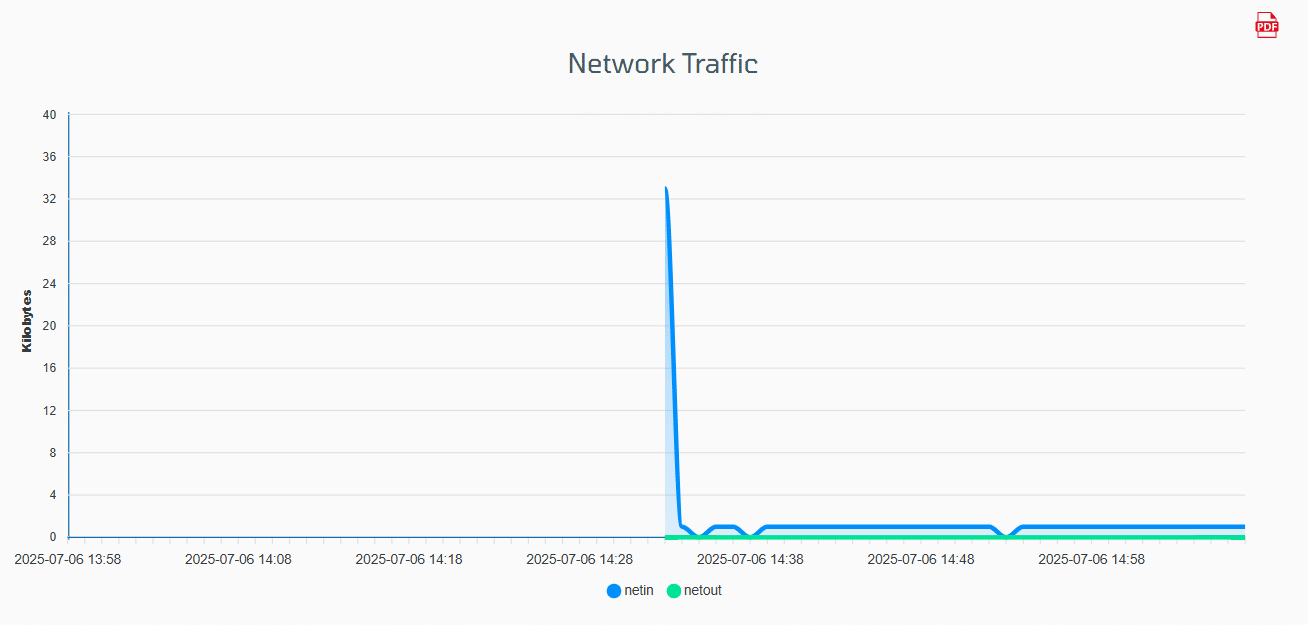
3. Network Traffic
- Visualizes inbound and outbound traffic (in Kbps or packets/sec).
- Enables you to track bandwidth usage and detect unusual spikes in activity.
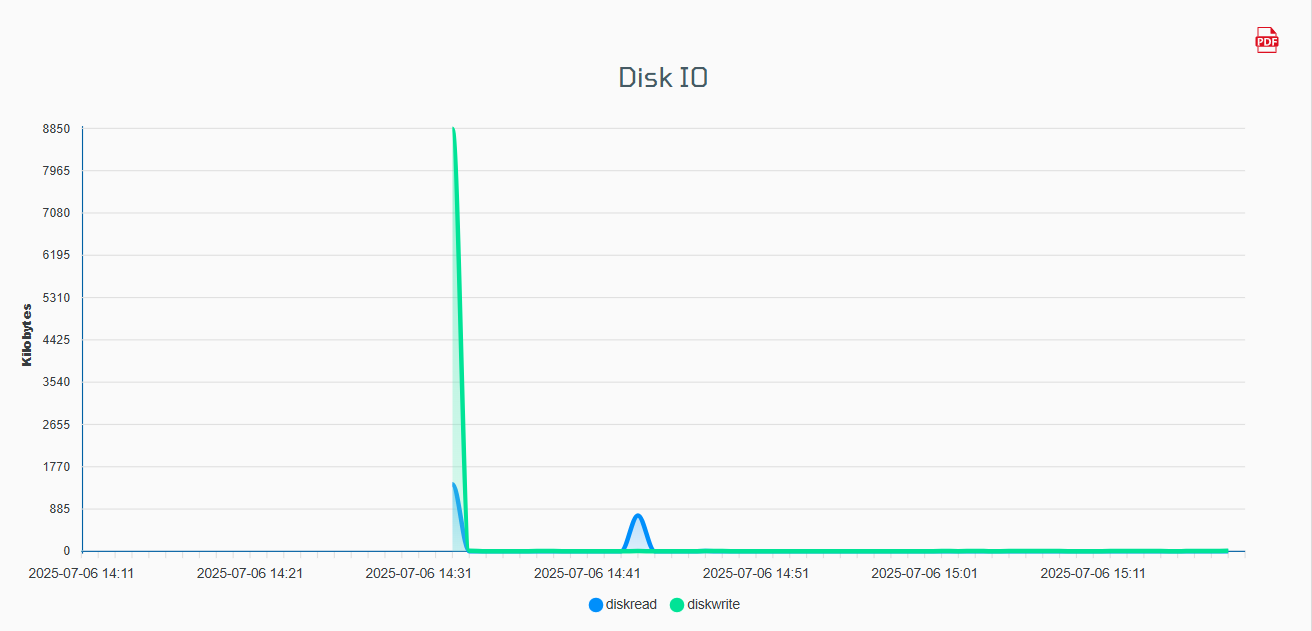
4. Disk I/O
- Represents read and write operations on your virtual disk.
- Helps analyze storage performance and pinpoint disk-intensive processes.
Export Options
PDF Export for Each Metric:
Each chart includes an option to export the data as a PDF, useful for reporting, troubleshooting, or sharing performance snapshots.
Export All Charts:
With one click, you can export all charts into a single PDF, providing a comprehensive overview of your VM’s performance at a glance.